


2014 Health Center Patient Survey Dashboard User Manual
Core Features
One of the core features is a bar chart that shows the percentage of health center patients who report different health outcomes. An outcome is a health state of a patient resulting from health care. Examples of outcomes available in the dashboard include:
- Needed medical care in the past year;
- Ever been diagnosed with diabetes; and
- Always or usually got a quick appointment for routine care.
In the dashboard, the percentage of patients who report an outcome (either a health condition or particular characteristic) is also known as the prevalence of that outcome. You can view the prevalence of an outcome for the overall health center patient population or selected demographic groups. Examples of demographic groups include:
- Patients with Medicaid;
- Male patients; and
- Patients aged 65 and older.
Selected Outcome
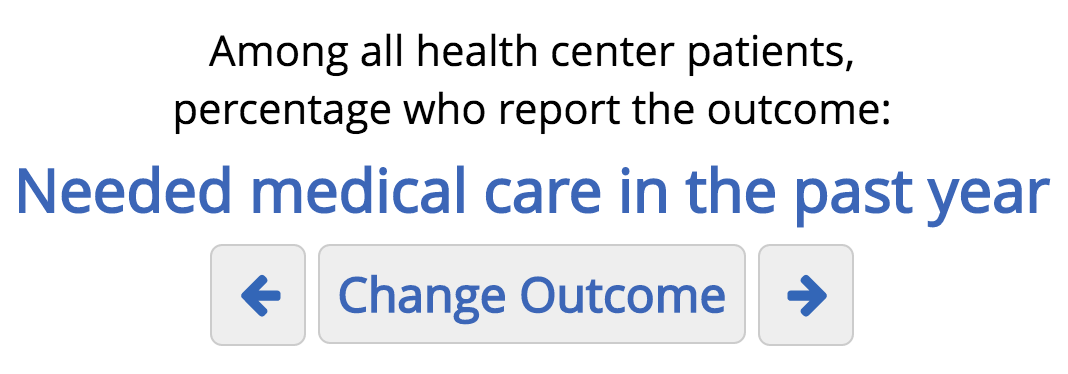
The currently selected outcome appears above the chart in the form of a chart title. When you first load the dashboard, the outcome selected by default is “Needed medical care in the past year.”
Figure 2: Selected outcome displayed in the chart title
To view results for a different outcome, you have two options:
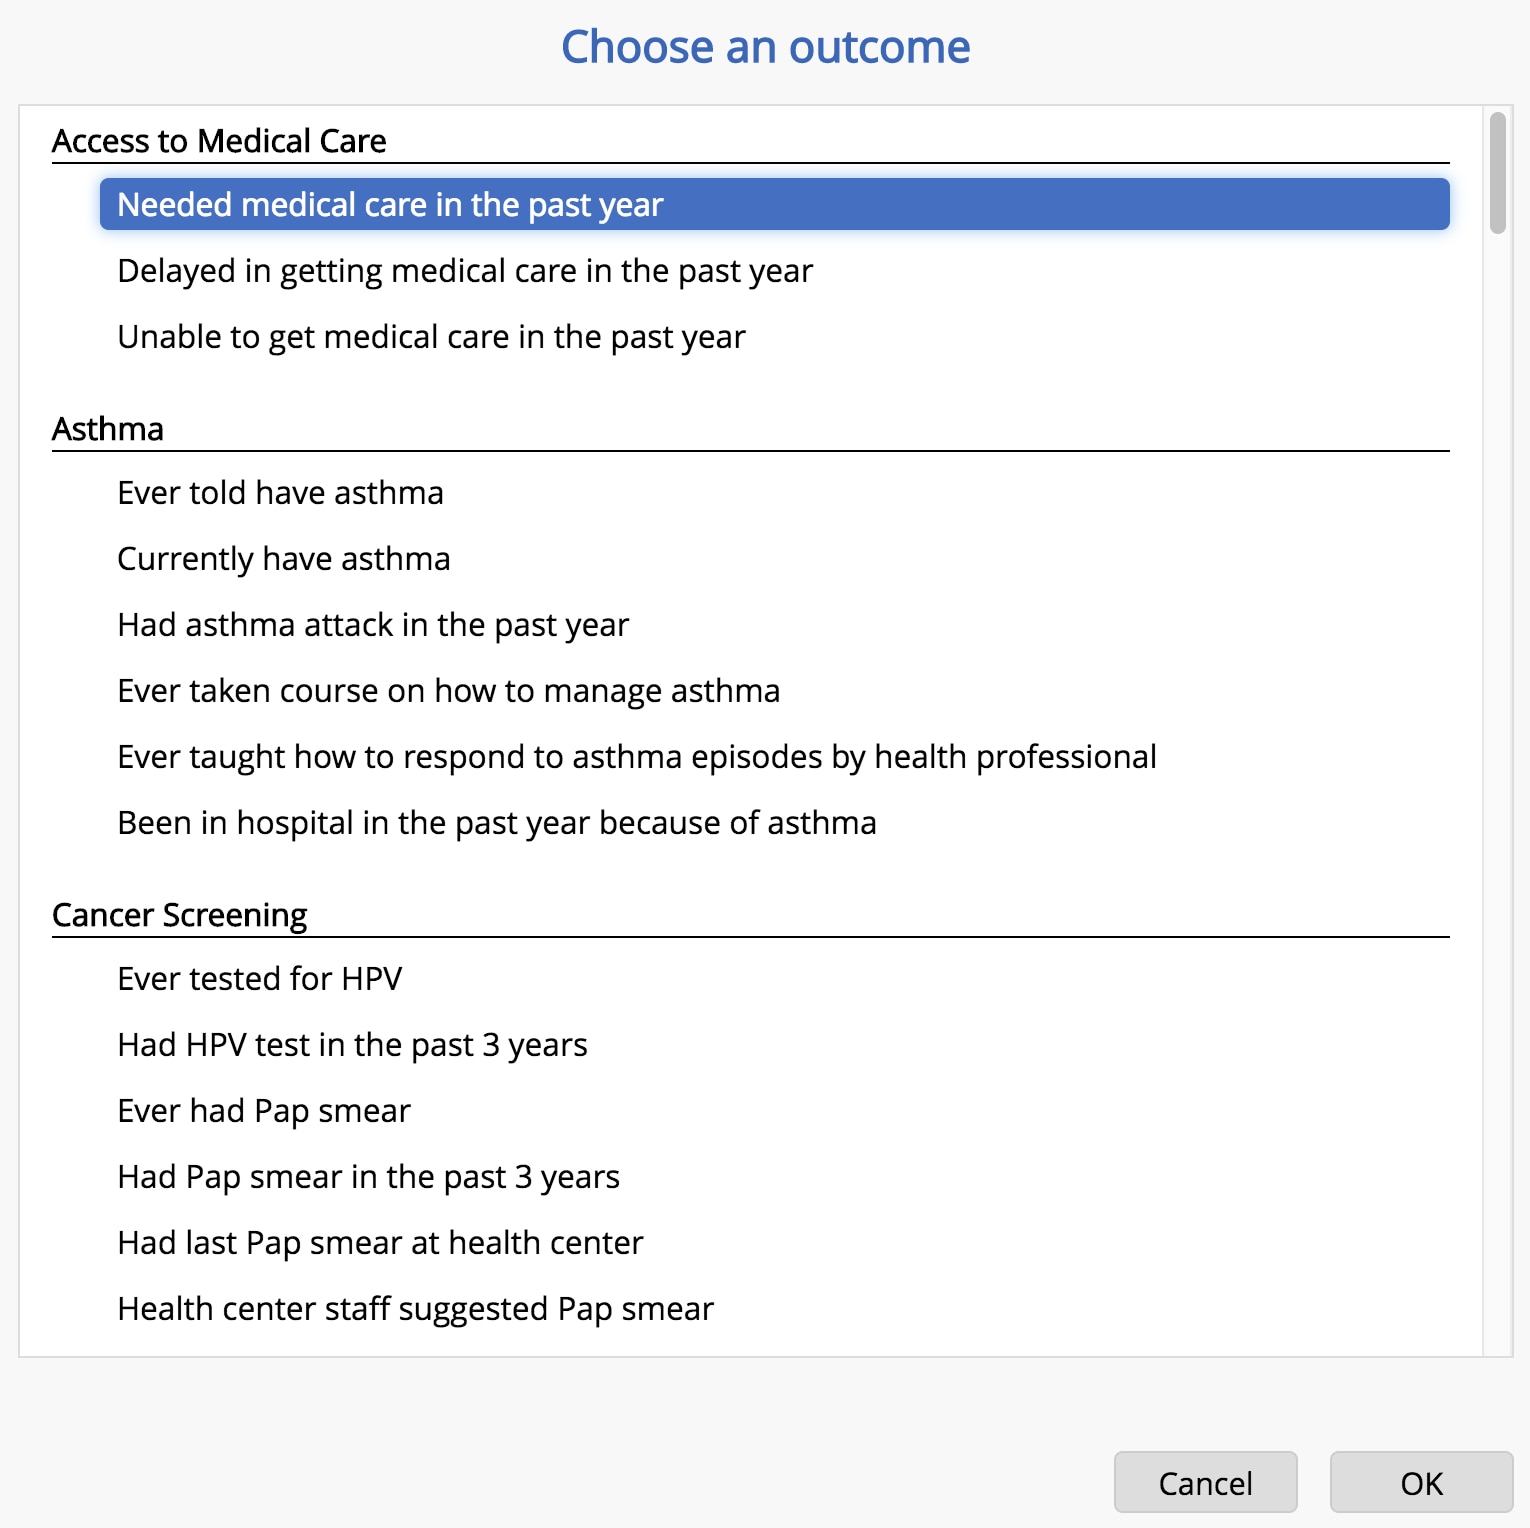
- Click the Change Outcome button. A dialog box displaying all available outcomes will open. In the dialog box, select an outcome, and then click the OK button to view its results in the chart. This method is useful if you have a specific outcome in mind, or if you want to see a full list of the available outcomes.
Figure 3: Dialog box for choosing a different outcome
- Click the Next and Previous outcome buttons, which appear as left and right arrows, located on either side of the Change Outcome button. Clicking one of these buttons will immediately update the chart to display the next (or previous) outcome from the full list. This method is useful to scroll through the outcomes and see the results for each one.
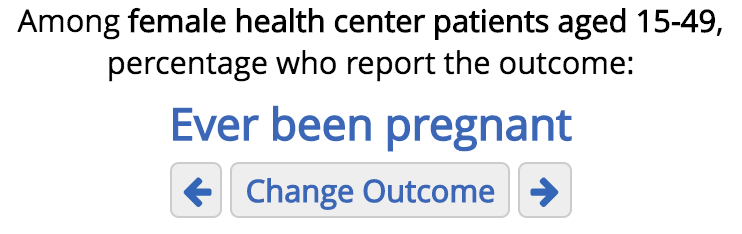
Some outcomes are based on questions that were not presented to every survey respondent. For example, only female respondents aged 15 to 49 were asked questions about pregnancy. This information is mentioned in the chart title. For example, when the selected outcome is “Been pregnant in the past 3 years,” the chart title is “Among female patients aged 15-49, percentage who report the outcome: Been pregnant in the past 3 years.”
Figure 4: Selected outcome does not apply to all patients
When an entire demographic group was excluded from answering a question, a note is displayed in the bar chart instead of a bar. For the pregnancy outcomes, for example, the bars for the “Gender: Male” and “Age: 65+” rows are replaced by the note “not asked.”
Bar Chart
The bar chart displays prevalence for the currently selected outcome in a visual form. You can easily compare prevalence across demographic groups and see how the demographic groups compare to the overall health center patient population.
Figure 5: Bar chart
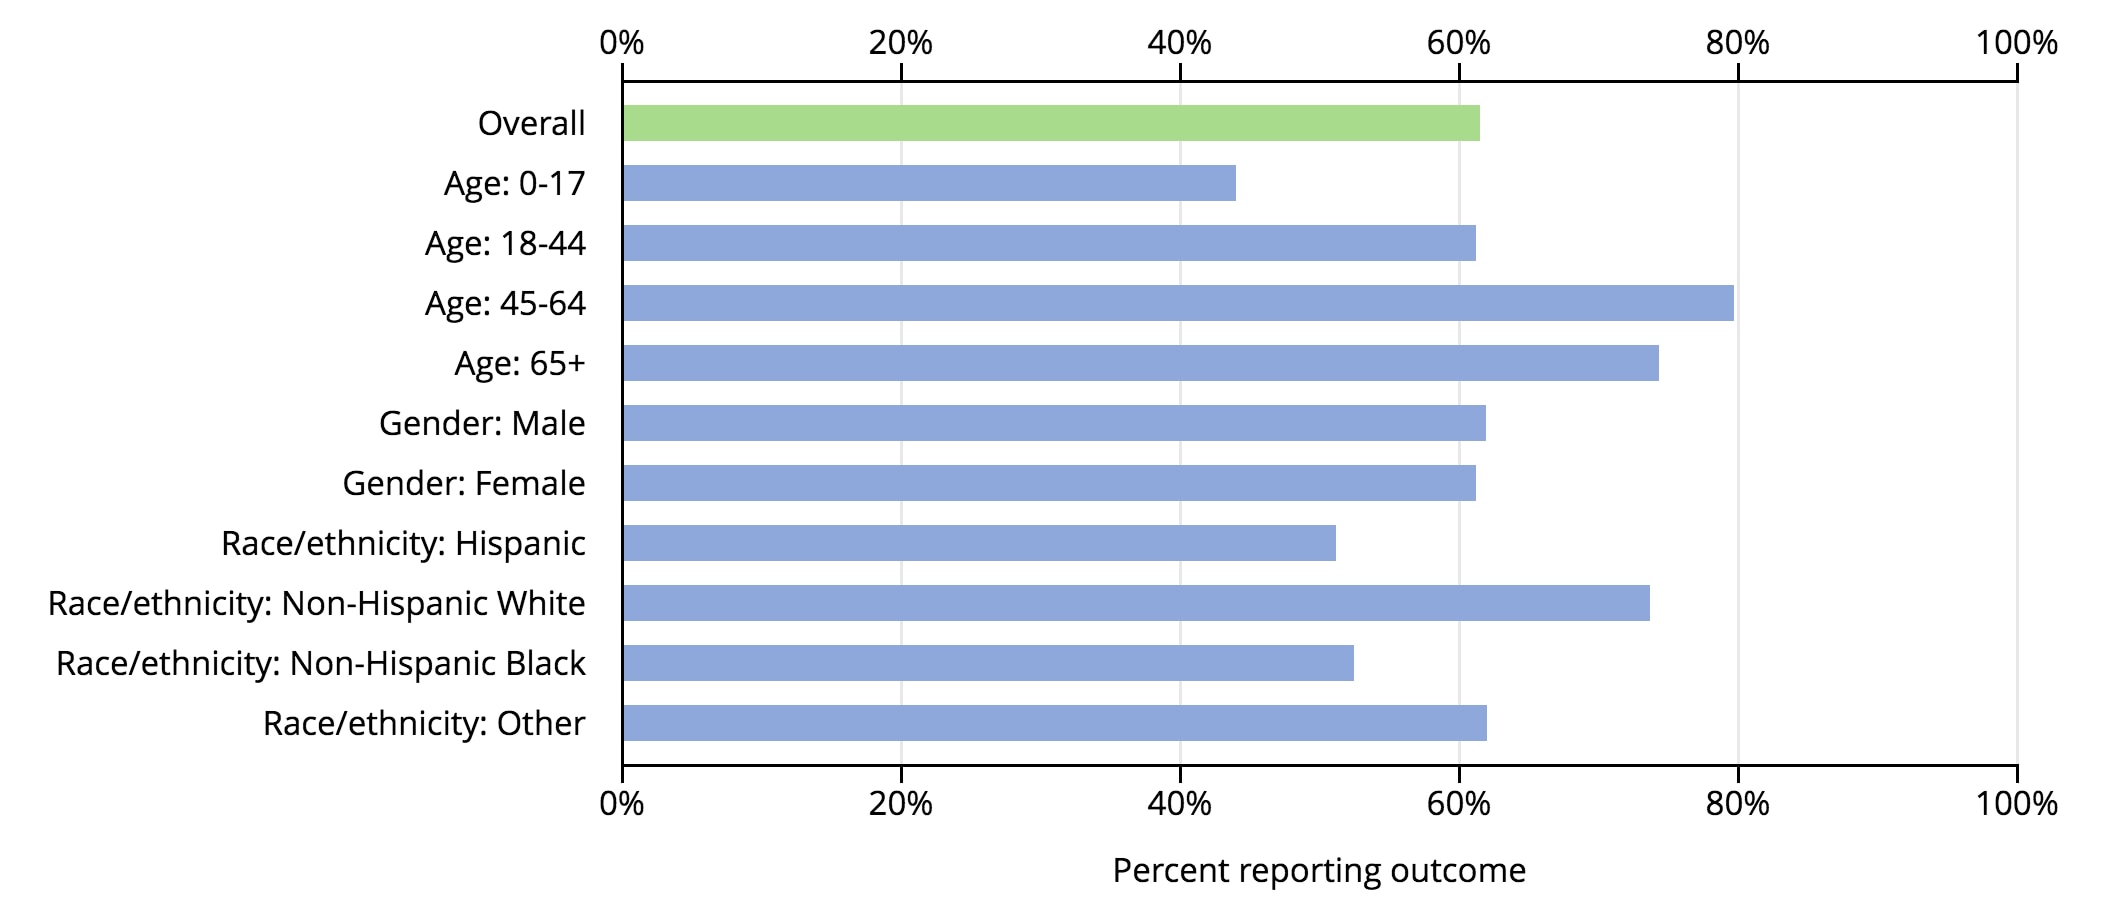
The bar chart consists of several horizontal bars. The length of the “Overall” bar represents the prevalence for the overall health center patient population. The other bars represent the prevalence for selected demographic groups.
For example, suppose the currently selected outcome is “Needed medical care in the past year.” If the “Age: 45-64” bar is longer than the “Overall” bar, then the percentage of health center patients between the ages of 45 and 64 who needed medical care in the past year is greater than the percentage in the overall health center patient population.
The length of a bar in the bar chart provides an estimate of the percentage associated with each bar. Moving your mouse over a row will display a small tooltip containing the exact percentage. In addition to the prevalence estimate, the tooltip also displays the estimated number of health center patients in the subgroup.
Continuing the example above, suppose the tooltip for the “Age: 45-64” row says “79.7% of 5.6 million patients.” This means that the health center patient population contains about 5.6 million people between the ages of 45 and 64, and 79.7 percent of those needed medical care in the past year.
Figure 6: Tooltip when hovering over the Age: 45-64 bar
