


2014 Health Center Patient Survey Dashboard User Manual
Filtering | Mobile Devices | Accessibility | Browser Compatibility | Computational Methods
Filtering
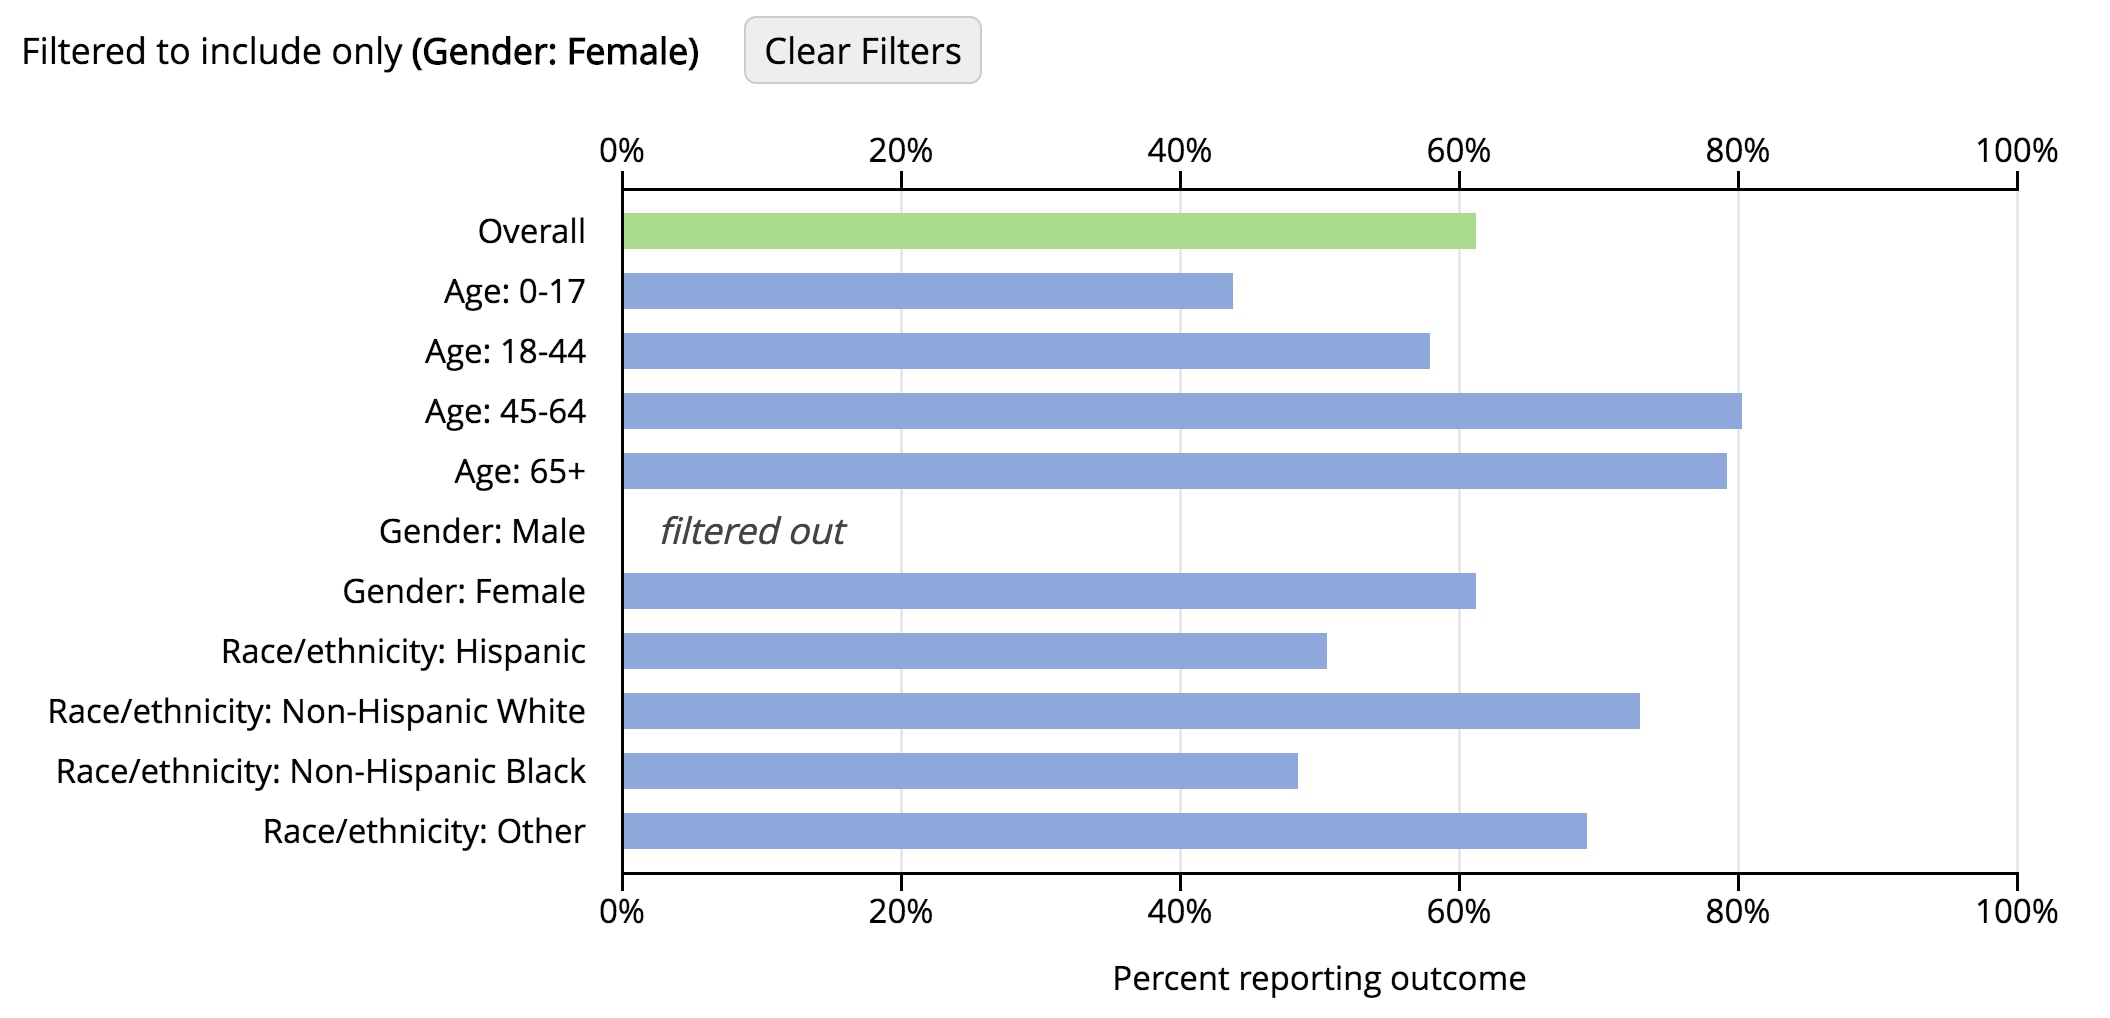
Filtering allows you to limit the analysis to certain demographic groups. This could also be called “drilling down” or “subsetting.” For example, if you are interested only in prevalence estimates for female patients, then you can filter to females, and every estimate in the chart will be recalculated only among females.
To apply a filter, click the name of the demographic group in the corresponding chart row. Filtering for females can be done by clicking the label “Gender: Female” in the chart. To remove a filter, click the label in the chart again. You can remove all filters at once by clicking the Clear Filters button.
Figure 12: Chart filtered to females
Applying multiple filters allows you to limit the analysis population to more targeted demographic groups. For example, suppose you want to limit the analysis population not just to females but to Hispanic females. This can be done by filtering to females and Hispanics simultaneously. If you want to limit the analysis population to female patients with Medicaid or Medicare, then you can filter to females, Medicaid, and Medicare simultaneously. These filtering examples appear in the following table.
Table 1: Effects of filters on the interpretation of selected chart rows
| Chart Row | Interpretation with No Filters Applied | Interpretation after Filtering to Females | Interpretation after Filtering to Females and Hispanics | Interpretation after Filtering to Females, High School, and More than High School |
|---|---|---|---|---|
| Overall | Prevalence among all patients | Prevalence among all female patients | Prevalence among all Hispanic female patients | Prevalence among all female patients with a high school education or greater |
| Age: 65+ | Prevalence among patients aged 65 and older | Prevalence among female patients aged 65 and older | Prevalence among Hispanic female patients aged 65 and older | Prevalence among female patients aged 65 and older with a high school education or greater |
| Race/ethnicity: Hispanic | Prevalence among Hispanic patients | Prevalence among Hispanic female patients | Prevalence among Hispanic female patients | Prevalence among Hispanic female patients with a high school education or greater |
| Education: More than High School | Prevalence among patients with more than a high school education | Prevalence among female patients with more than a high school education | Prevalence among Hispanic female patients with more than a high school education | Prevalence among female patients with more than a high school education |
As you limit the analysis population and use more filters, the number of survey respondents used to compute the prevalence estimates in the chart gets smaller, and the statistical reliability of the prevalence estimates decreases. The dashboard suppresses, or does not show, prevalence estimates when the reliability drops below a certain threshold. Prevalence estimates that are not reliable do not appear in the chart because the estimated percentages are unstable and subject to misinterpretation. Therefore, the more filters you add, the more likely you are to encounter suppression.
Return to TopMobile Devices
You may use the dashboard on a tablet, mobile phone, or other device with a small screen. Certain features are disabled on smaller devices due to space limitations. In particular, the choice of chart view versus table view is eliminated. Only table view is available. The option to display confidence intervals is also unavailable.
Return to TopAccessibility
You can access all interactive features of the dashboard from the keyboard using standard web navigation keys:
Tab and Shift-Tab move forward and backward through the interactive elements on the page.
- Enter activates buttons and links.
- Space toggles check boxes.
- The arrow keys change the active radio button in a radio button group.
You can access the dashboard using screen reader software. Screen reader users may find the table view more convenient than the chart view.
Return to TopBrowser Compatibility
The dashboard is compatible with current versions of major browsers (e.g., Chrome, Firefox, Internet Explorer). It is also compatible with older versions of Internet Explorer through version 9, with the exception that the Download CSV option is unavailable in Internet Explorer 9.
JavaScript must be enabled in your browser for the dashboard to function. If you prefer to disable JavaScript, then you may download the public use data file for offline analysis.
Return to TopComputational Methods
Individual records in the 2014 Health Center Patient Survey public use data file are weighted so that estimates from the survey data are representative of the entire health center patient population. All dashboard calculations make use of the weights. In addition, the 95 percent confidence intervals presented in the dashboard are computed to reflect the stratification and clustering in the survey’s sample design. As a result, prevalence estimates in the dashboard are comparable to those you obtain from analyzing the public use data file in survey analysis software such as SUDAAN, SAS, SPSS, or Stata.
Prevalence estimates do not appear in the dashboard in cases where the statistical reliability of the estimate is poor. For the dashboard, poor statistical reliability is defined as meeting either of the following criteria:
- The calculated percentage is based on fewer than 50 survey responses.
- The relative standard error (RSE) of the percentage is greater than 30 percent. The standard error of a percentage is primarily a measure of the sampling variability that occurs by chance because only a sample is surveyed, rather than the entire population.
Table 2: Relative standard error
| For percentages | The RSE is |
|---|---|
| Greater than 0 percent but less than or equal to 50 percent | Calculated as SE(p) / p, where p is the percentage expressed as a proportion, and SE(p) is the standard error of the proportion |
| Greater than 50 percent but less than 100 percent | Calculated as SE(p) / (1 - p) |
| Equal to 0 percent or 100 percent | Undefined, and this suppression criterion is ignored |